Advanced bot analytics
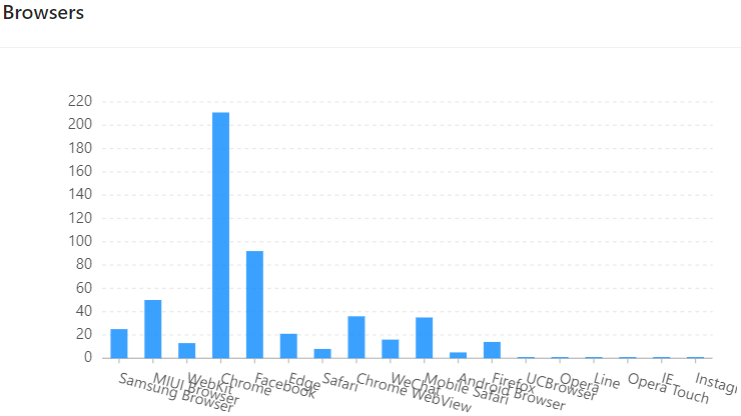
Browsers များသိနိုင်ခြင်း
Chatbot ကိုစကားလာပြောတဲ့ Customer တွေအသုံးပြုတဲ့ Browsers နဲ့ Applications တွေကို လေ့လာနိုင်မှာပါ။
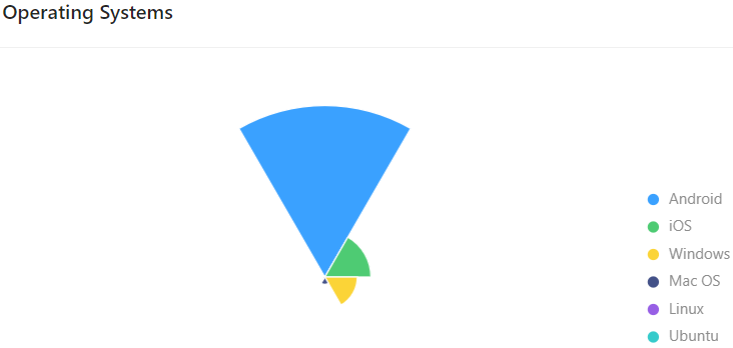
Operating Systems တွေသိနိုင်မယ်
Chatbot ကိုစကားလာပြောတဲ့ Customer တွေအသုံးပြုတဲ့ Operating Systems များဖြစ်တဲ့ Android, iOS, Windows, Mac OS, Linux, Ubuntu စတာတွေလည်း ကြည့်လို့ရမှာဖြစ်ပါတယ်။
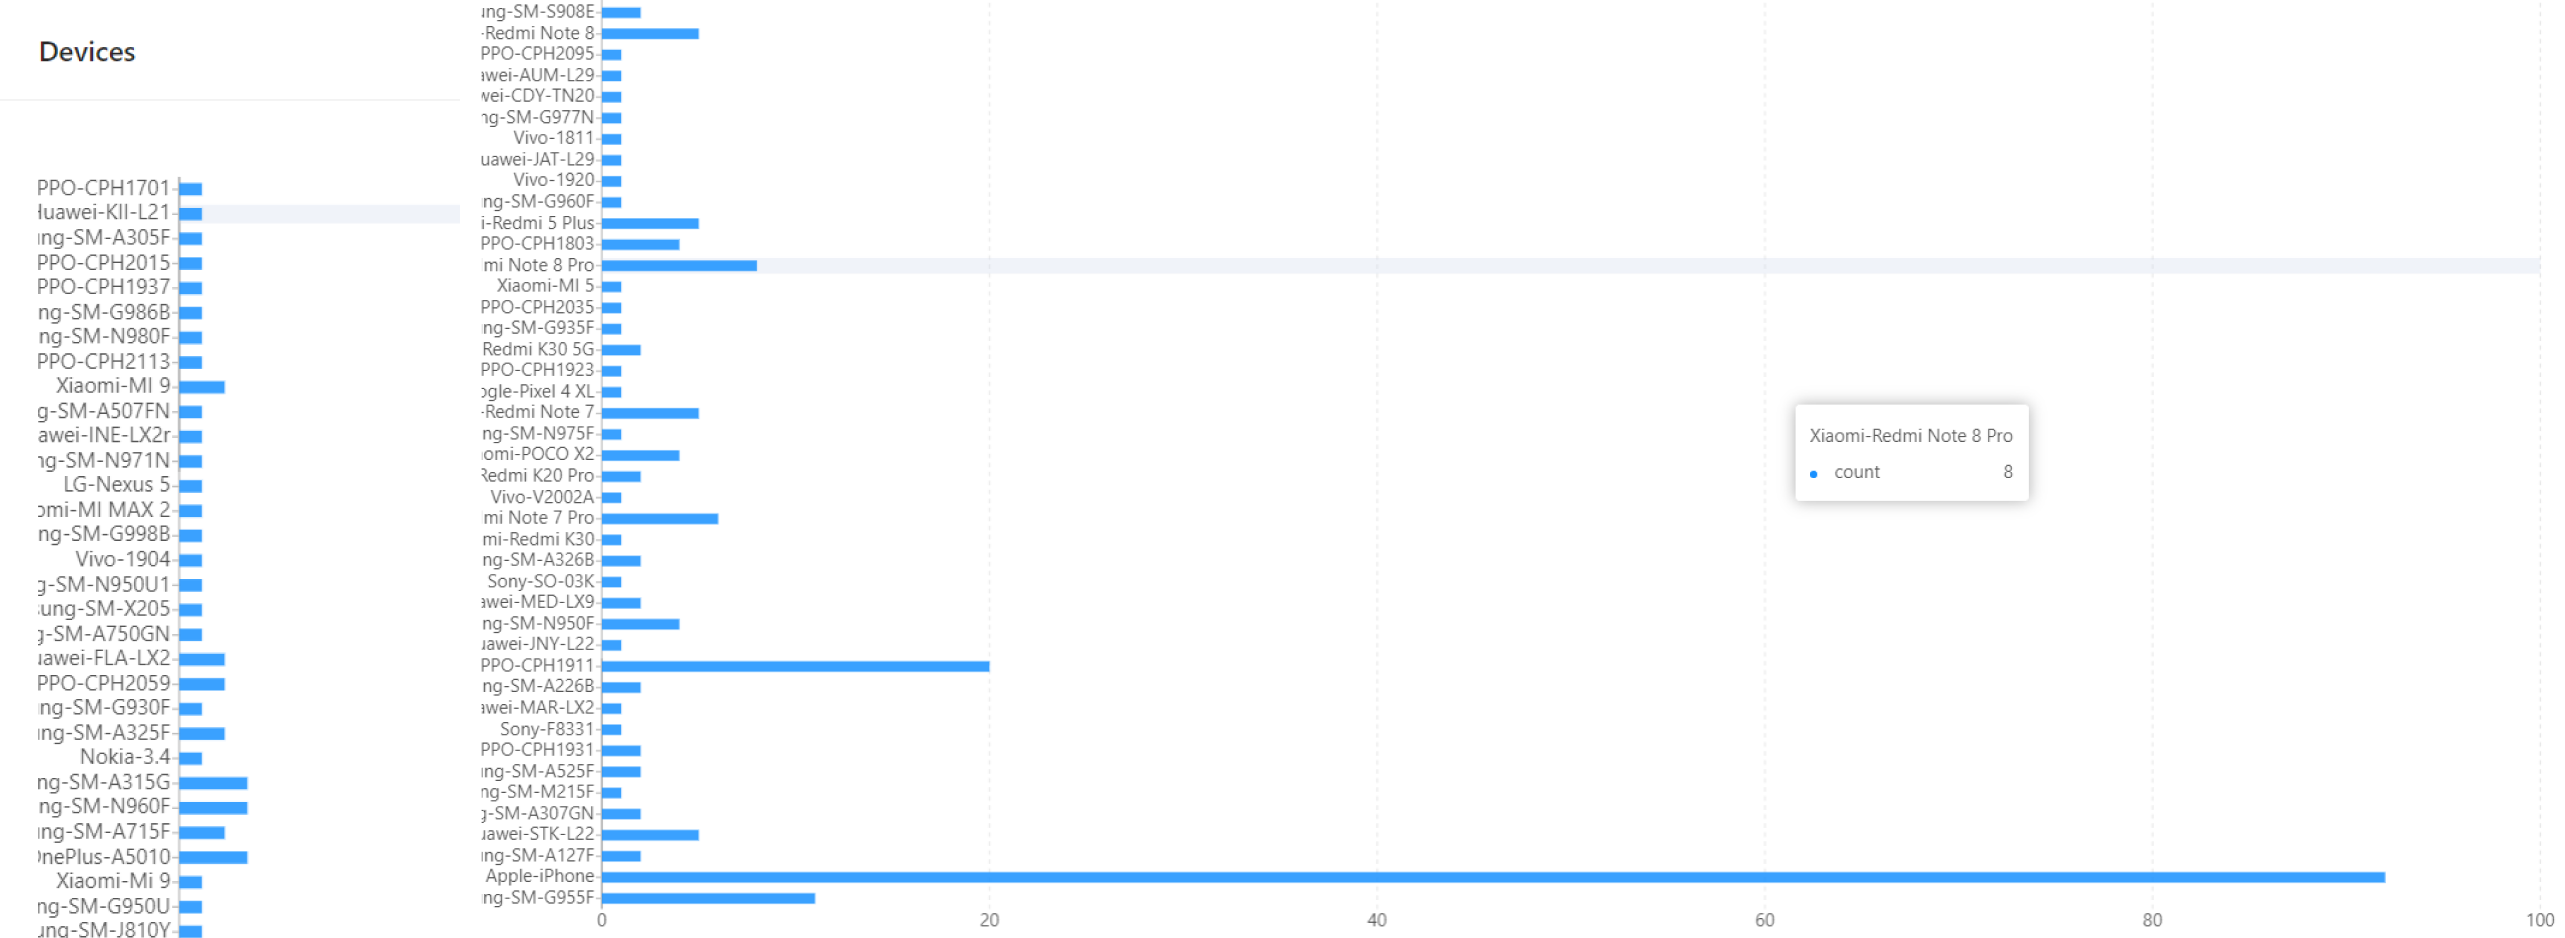
User Devices အသေးစိတ်
Chatbot ကိုစကားလာပြောတဲ့ Customer တွေအသုံးပြုတဲ့ Device info ကိုလည်း လေ့လာနိုင်မှာဖြစ်ပါတယ်။
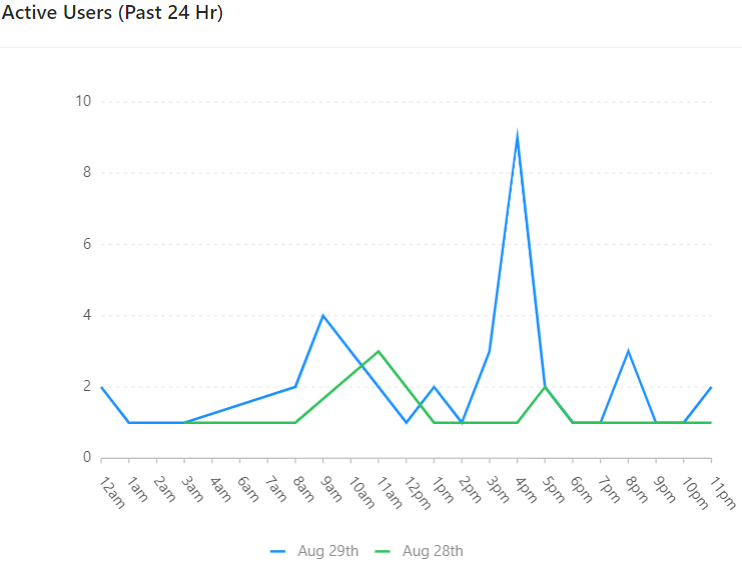
Active Users (Past 24 Hr) များ
လွန်ခဲ့တဲ့ 24 နာရီအတွင်း Active customer တွေကို graph နဲ့ ဖော်ပြပေးထားမှာဖြစ်ပါတယ်။
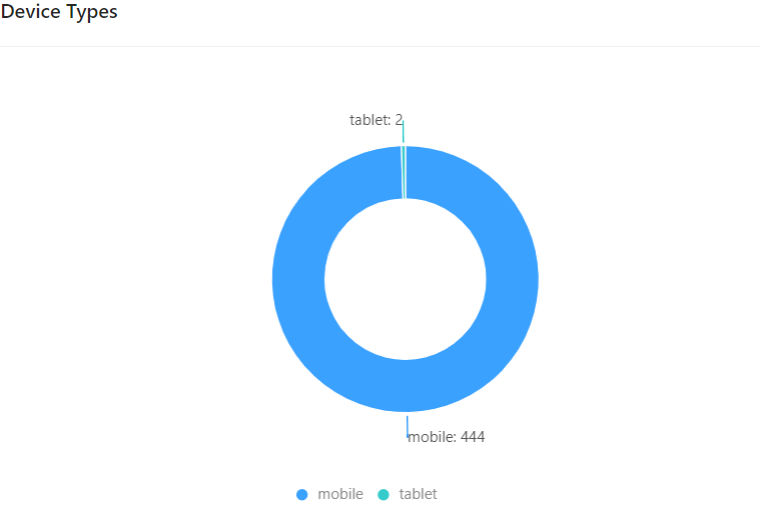
Device Types ခွဲခြားကြည့်မယ်
Page Inbox ကိုစကားလာပြောတဲ့ User တွေထဲက Mobile အသုံးပြုသူများနဲ့ Tablet အသုံးပြုသူများအတွက် အရေအတွက်ဘယ်လောက်ရှိတယ်ဆိုတာ Circle View ပေါ်ကို cursor လေးတင်ကြည့်ရုံဖြင့် ခွဲခြားသိမြင်နိုင်ပါတယ်။
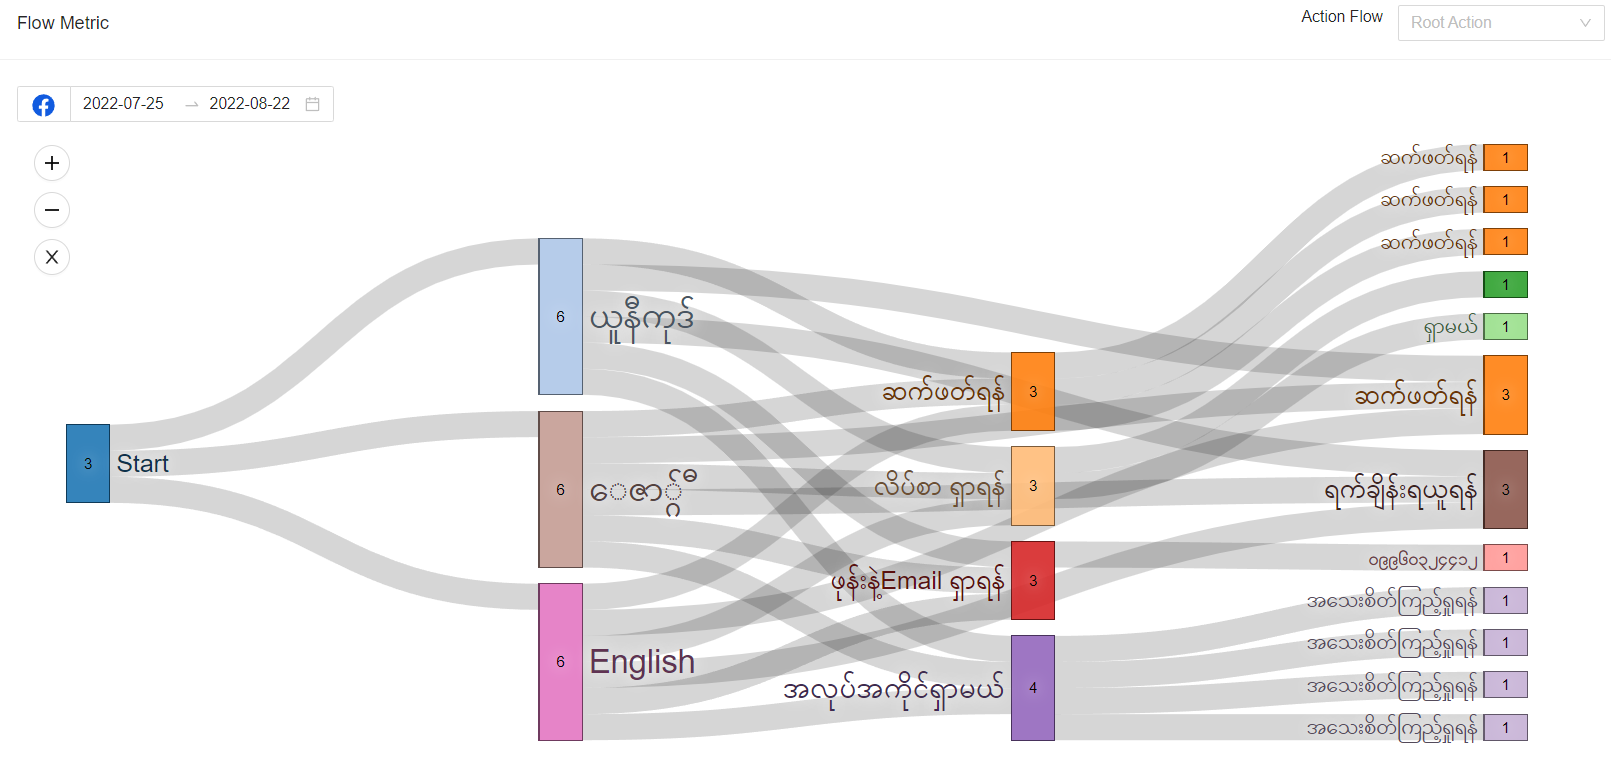
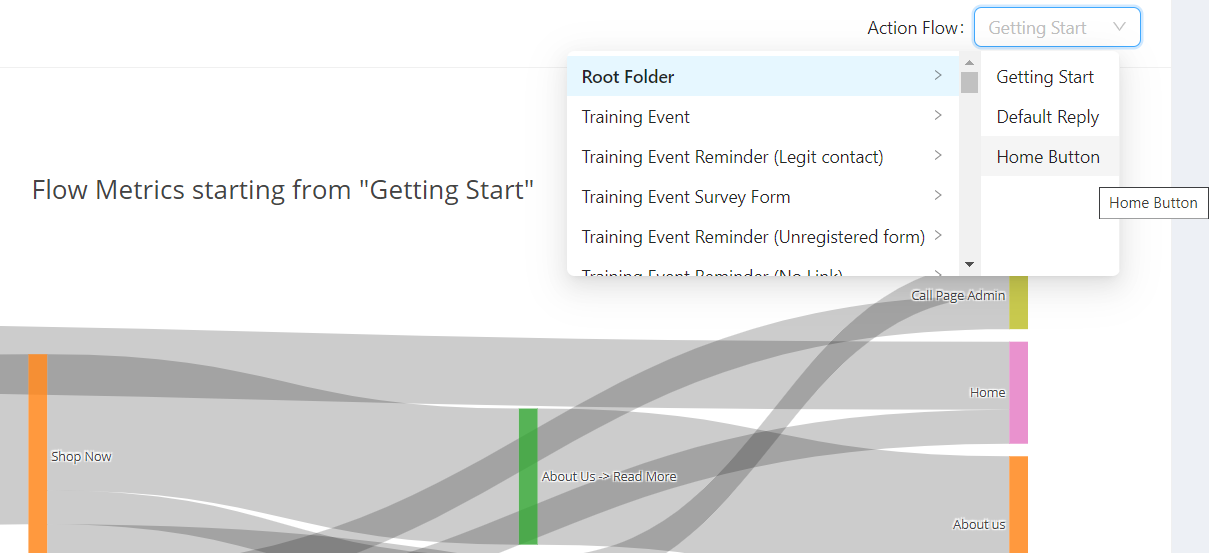
Flow Metric ဆိုသည်မှာ
Chatbot ကို စကားလာပြောတဲ့ user တွေ နှိပ်သွားတဲ့ Chatbot Flow နာမည်များ (Action names) နဲ့ Click count များ မြင်နိုင်မယ့်နေရာလေးပဲဖြစ်ပါတယ်။ Flow နာမည် တွေကိုတော့ Chatbot ထဲက Action Name တွေ အနေနဲ့ ဖော်ပြပေးမှာပါ။ အောက်ပါပုံမှာပြထားတာကတော့ Bot Builder > Main Botflow မှာ ရှိတဲ့ Action names တွေရဲ့ Flow metric ပဲဖြစ်ပါတယ်။
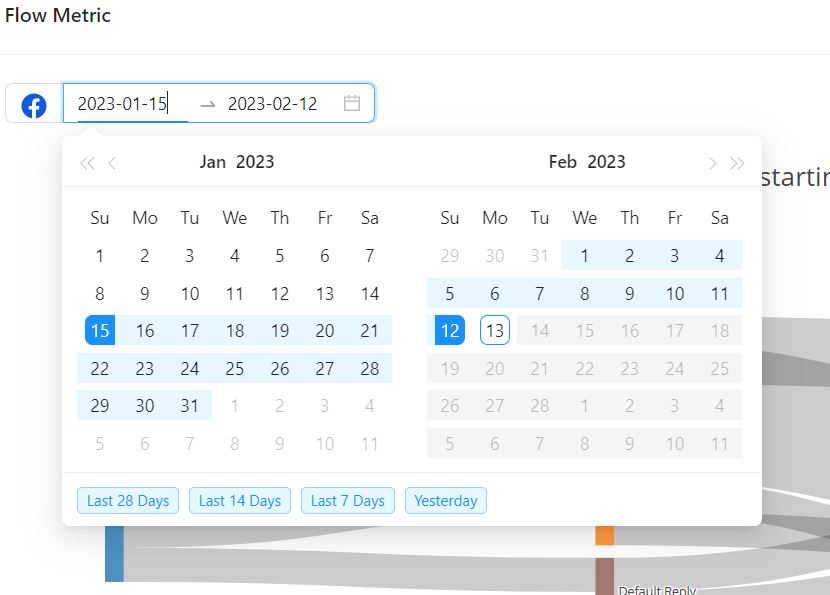
Flow metric - filter စစ်မယ်
Data တွေကို date to date အလိုက် filter ကြည့်နိုင်မယ့်နေရာပဲဖြစ်ပါတယ်။
Flow metric - Action flow ကြည့်မယ်
Action flow: မှာဆိုရင် Main Botflow က bot actions များသာမက Botflows အောက်မှာ folder တွေနဲ့ ခွဲဆောက်ထားတဲ့အထဲက bot action count တွေကိုပါ စစ်ကြည့်နိုင်မှာဖြစ်ပါတယ်။
Conversation Stats
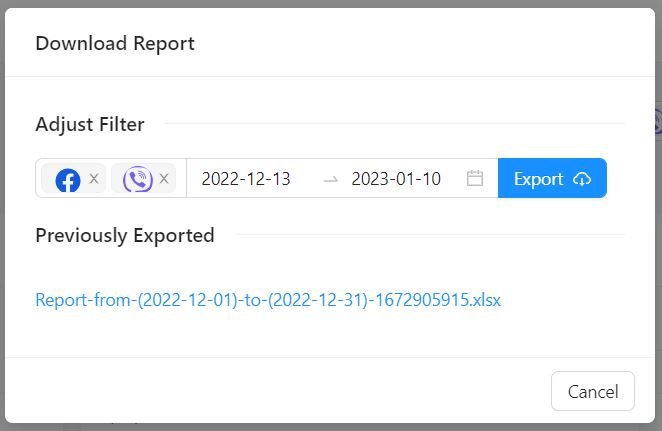
Download Report (Bot Analytics) အသုံးပြုပုံ
Conversation analytic data တွေကို ပုံမှာမြင်တွေရတဲ့ Go to Conversation Statistics ကနေ overview အနေနဲ့ ကြည့်နိုင်မှာဖြစ်သလို Excel Format အနေနဲ့လည်း Download ရယူနိုင်မှာဖြစ်ပါတယ်။
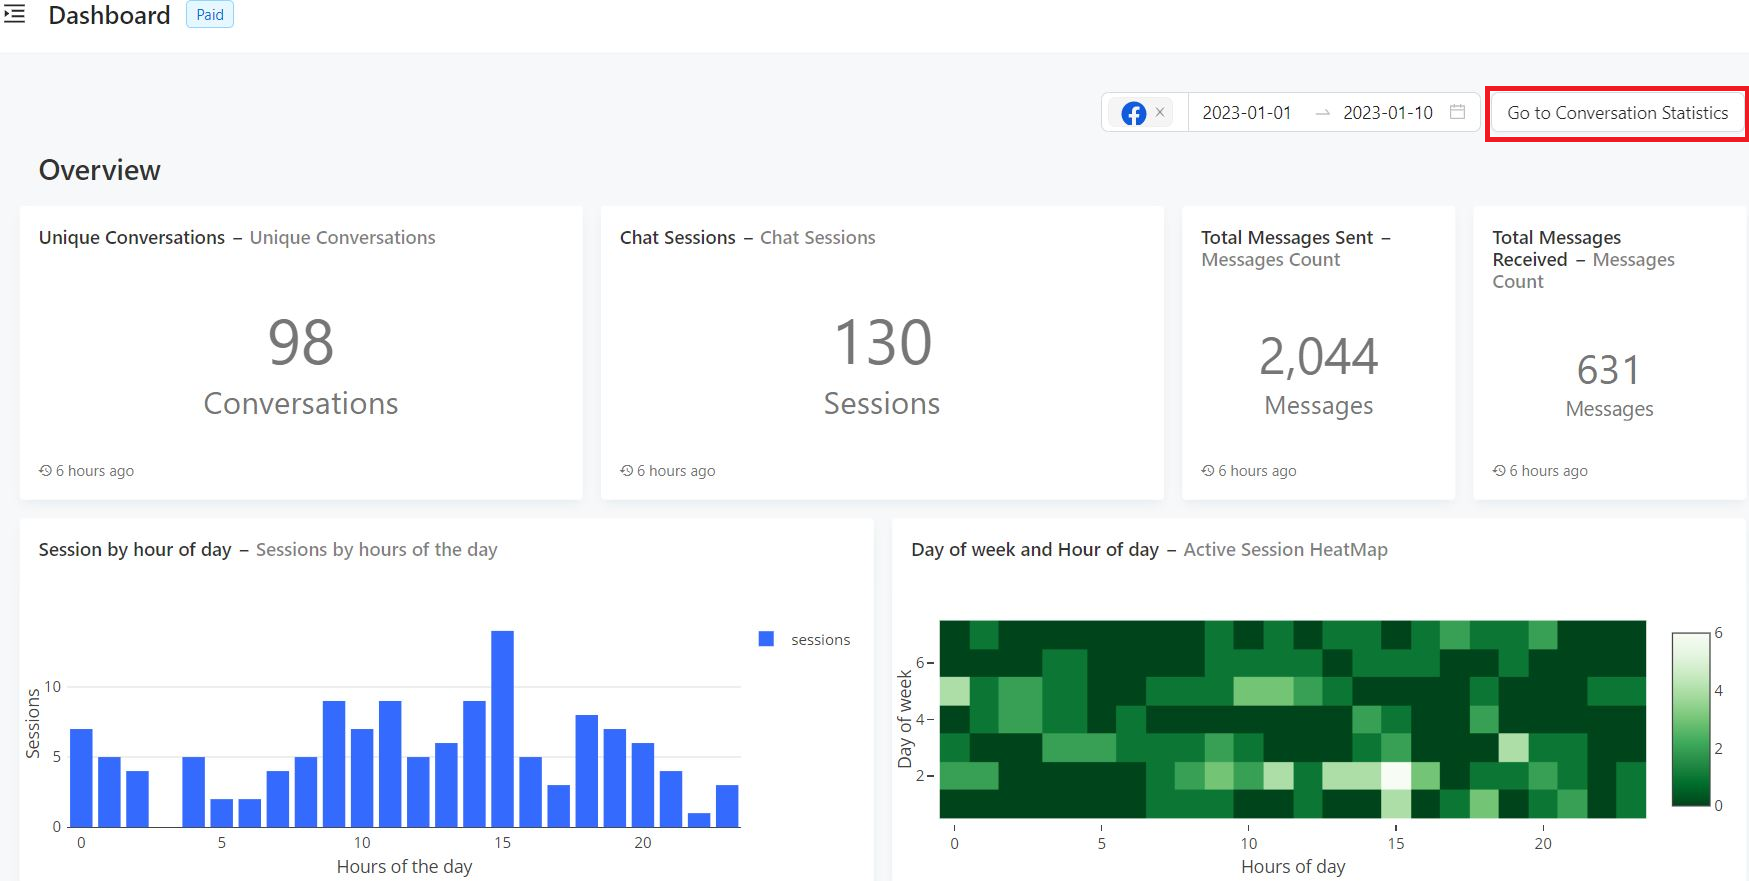
Go to conversation statistics မှာတော့ အလွယ်တကူနှိပ်ကြည့်လို့ ပိုအဆင်ပြေအောင် Message channel (Facebook, Viber) ရွေးနိုင်မှာဖြစ်ပြီး Monthly, Yearly အလိုက် ပြောင်းပြီး ချိန်ကြည့်နိုင်မှာဖြစ်ပါတယ်။ မိမိရွေးလိုတဲ့ Message channel, Month, Year ကို Filter ရွေးပြီးပြီဆိုရင်တော့ Apply filter နှိပ်လိုက်တာနဲ့ data overview ကြည့်လို့ရပီပဲဖြစ်ပါတယ်။
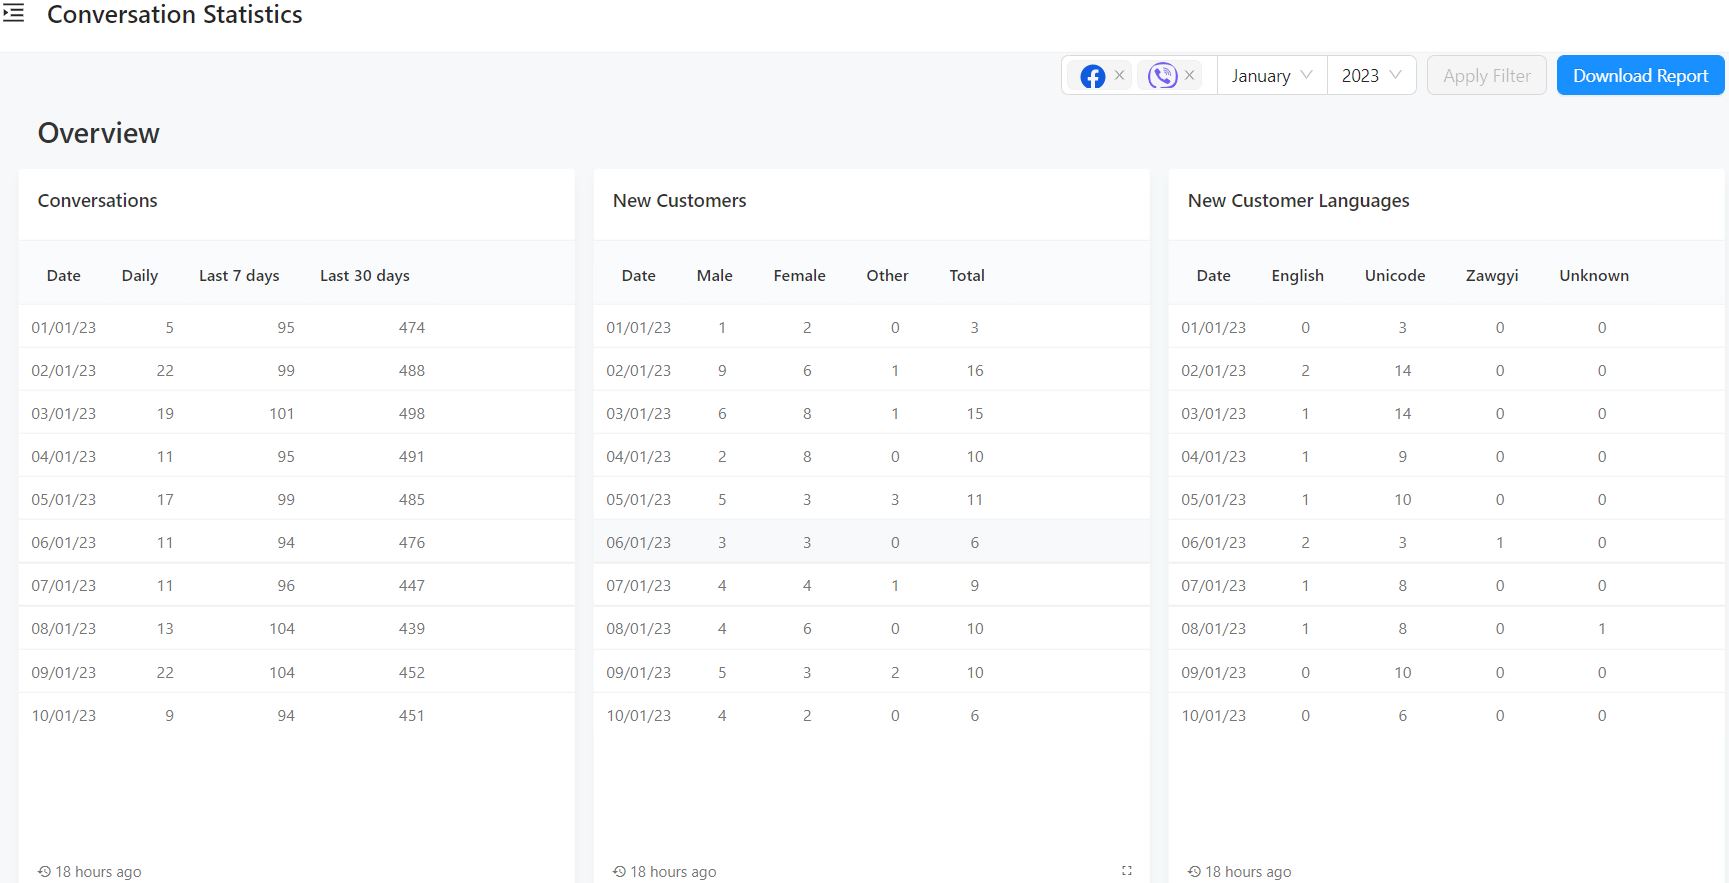
Excel Report ထုတ်ဖို့ဆိုရင် အရင်ဆုံး Download Report ကို click ပေးပါ။ ပြီးတဲ့အခါ ကိုယ်ထုတ်ချင်တဲ့ရက် အတိအကျကို Adjust Filter မှာ Date To Date ရွေးပေးဖို့လိုပါမယ်။


ရွေးပြီးပြီ ဆိုရင်တော့ “ Export ” Button ကိုနှိပ်ပြီး Report ထုတ်နိုင်ပါပြီ။ အရင်က Export ထုတ်ခဲ့ဖူးတဲ့ Excel report file တွေကိုလည်း Previously Exported အောက်မှာ တွေ့နေရမှာဖြစ်ပါတယ်။